
Eden Park's short straight boundary and a Phillips storm: New Zealand bury India by 87 runs under their highest T20I total
**सीधा उत्तर:** ऑकलैंड के ईडन पार्क में न्यूज़ीलैंड ने भारत के खिलाफ़ 7 विकेट पर 259 रन बनाए — उसका सर्वोच्च टी20 अंतरराष्ट्रीय स्कोर — और भारत 20 ओवर में 9 विकेट पर 172 रन ही बना सका, यानी 87 रन से हार गया। **मुख्य तथ्य:** - ग्लेन फिलिप्स: 49 गेंदों पर 107 रन, स्ट्राइक रेट 218.4, 6 चौके और 10 छक्के; शतक 46 गेंदों पर - माइकल ब्रेसवेल: 19 गेंदों पर 50 रन (स्ट्राइक रेट लगभग 263) - फिलिप्स-ब्रेसवेल साझेदारी: 40 गेंदों पर 115 रन (रन रेट 17.25) - न्यूज़ीलैंड: 10.4 ओवर पर 109/4, फिर अंतिम 9.2 ओवरों में लगभग 150 रन; कुल 20 छक्के - भारत का पीछा: पहले ओवर में 2 विकेट, छह ओवर में 4 विकेट; अंत में 172/9 (रन रेट 8.6) - सबसे महंगे स्पेल: नितीश रेड्डी 4-0-64-0 (16वें ओवर में 32 रन); सबसे किफ़ायती: अर्शदीप सिंह 4-0-38-1 **सवाल-जवाब:** - *सर्वोच्च स्कोर का कारण?* डेथ ओवरों में भारतीय गेंदबाज़ी अनुशासन का टूटना, न कि पूरे 20 ओवर का दबदबा। - *क्या 259 रन सामान्य मानक है?* नहीं — ईडन पार्क की असामान्य रूप से छोटी सीधी सीमा स्कोर को बढ़ाती है; रिकॉर्ड आंशिक रूप से मैदान-निर्मित है। - *क्या मयंक यादव का 3 विकेट अच्छा स्पेल था?* नहीं — 48 रन देकर 3 विकेट यानी 12 की इकॉनमी; विकेट रनों की कीमत पर लिए गए।
Auckland: The unusual geometry of Eden Park, a Glenn Phillips innings of 107 off 49 balls, and the complete unravelling of India's bowling in the final ten overs turned this T20I into a one-sided affair. New Zealand posted 259/7 — their highest ever T20I total — and India could only manage 172/9 in 20 overs, losing by 87 runs.
The scorecard is deceptively simple. It is tempting to read 259 as 20 overs of unbroken dominance. The opposite is true. New Zealand were 109/4 after 10.4 overs, and at that point India appeared to have the innings under control. What followed was less a batting masterclass across the full innings and more a structural bowling failure: roughly 150 runs in the final 9.2 overs, a run rate of about 16.1.
That number is the real story. A 259 total is not the product of one freak over; it is the signature of a death-phase plan, line, length and pressure management all collapsing together. Look at the composition of India's attack: Arshdeep Singh, Mayank Yadav, Prince Yadav, Axar Patel, Nitish Reddy and Naman Dhir — six options, none of whom could play the anchor-controller role across 20 overs. In the back ten, India simply had no third experienced option to absorb pressure.
The first ten overs: control, and an illusion
New Zealand started fast but not sustainably. Finn Allen made 31 off 17 and Daryl Mitchell 24 off 9; neither went on. That pattern matters because New Zealand's top order kept offering India a route back in. One more wicket in the middle overs and 259 becomes implausible. The gap was filled by Phillips and Bracewell, with 115 off 40 balls.
Glenn Phillips: 107 off 49, strike rate 218.4
Three numbers explain the innings. First, a strike rate of 218.4 — elite finisher territory, where even exceptional innings rarely cross 180. Second, 84 of his 107 runs came in boundaries: six fours and ten sixes, or 78.5 percent boundary dependence. Third, the hundred came off just 46 balls, matching his own second-fastest T20I hundred for New Zealand.
A caveat is essential. It would be wrong to conclude that Phillips has become a 220-strike-rate batter. Two facts pull in opposite directions. On one hand, he already had two fifties in the series, so this is current form, not a one-match outlier. On the other, at a ground where the straight boundary is unusually short, with 78.5 percent of runs in boundaries, this innings will not replicate elsewhere. The correct reading is sustained form plus venue amplification — not a new performance tier.
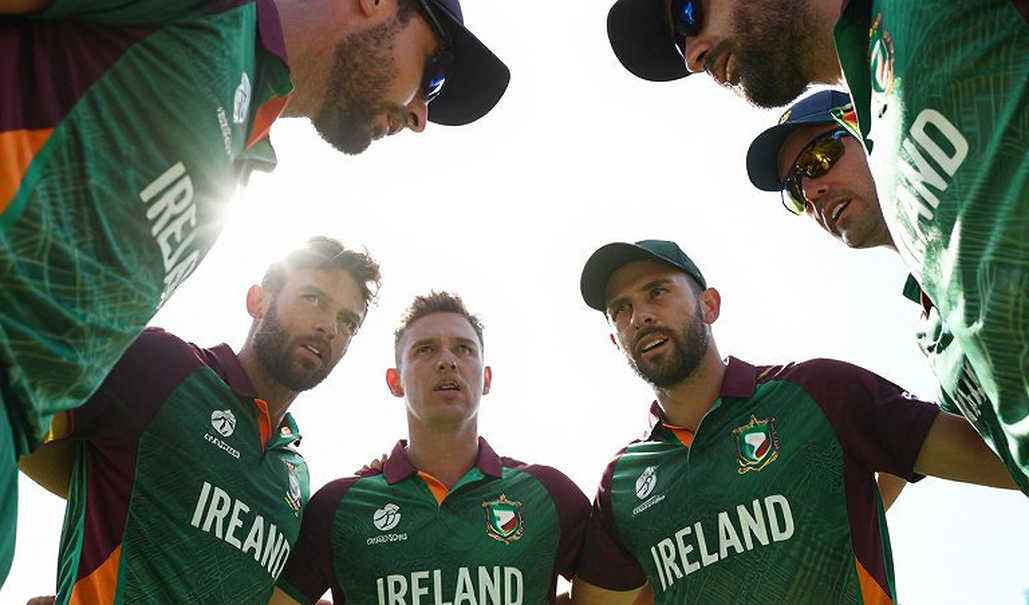
Michael Bracewell: 50 off 19 — arguably the more structurally significant innings
Phillips will take the headlines, but Bracewell's 50 off 19 (strike rate around 263) was no less important. At 109/4 the innings was stalling, and Bracewell, at six or seven, delivered the scarce premium of a genuine bowling all-rounder. He took 16 off Naman Dhir's opening over and hit four fours and a six in Axar Patel's third over — aggressive against spin from ball one.
That was India's costliest tactical miss. In the phase where India needed spin to control the game, they faced a batter targeting spin directly. Bracewell's innings did what a death-over surge does: it converted a respectable total into a winning one. A 115-run stand off 40 balls at 17.25 an over is an explosive partnership profile.
India's bowling returns
- Arshdeep Singh: 4-0-38-1, economy 9.50 — best of the unit, the only bowler under 10
- Mayank Yadav: 4-0-48-3, economy 12.00 — three wickets, but expensive
- Prince Yadav: 4-0-49-0, economy 12.25 — four overs without a wicket
- Axar Patel: 3-0-43-0, economy 14.33 — frontline spinner taken down
- Nitish Reddy: 4-0-64-0, economy 16.00 — most expensive spell
- Naman Dhir: 1-0-16-0, economy 16.00 — abandoned after one over
The arithmetic confirms the scorecard's internal consistency: 242 runs from the five bowlers' 19 overs plus 16 from Dhir's single over equals 258, matching 259/7 with the extras. It also means India's entire 20 overs came from exactly three Axar overs, one part-time over and 16 seam overs — a selection logic that looks reversed on a ground with a short straight boundary.
The 16th over: 32 runs and five sixes
Nitish Reddy's spell is the single most damaging individual return, and it reflects a role-fit problem rather than merely a bad day. Six of New Zealand's 20 sixes came off him. His first two overs were relatively economical, but the 16th went for 32, including five Phillips sixes, three of them consecutive. This is the profile of a part-time seam option asked to bowl a full quota in the death phase — a squad-structure issue surfacing at the worst possible time.
Mayank Yadav's three wickets: a misleading headline
Three wickets for 48 in a total of 259 means those wickets were bought at 12 an over. His one genuinely high-value ball was the searing yorker that dismissed Daryl Mitchell (24 off 9) — a ball that interrupted momentum rather than reversing it. Judging the spell by wickets alone is a classic analytical error.
Eden Park's geometry: half the record's secret
The straight boundaries here are unusually short and the square boundaries extraordinarily long. That geometry rewards straight hitting and punishes any full length that feeds the arc. New Zealand's 20 sixes are a product of that geometry. Reading 259 and 20 sixes as a normal T20I benchmark would therefore be a mistake — the record is partly venue-manufactured. The conventionally safer plan at this ground is control spin and cutters rather than full pace into the arc. India's selection looked the reverse.
India's chase: four wickets inside six overs
Chasing 260, India needed roughly 13 an over from the first ball. Two wickets fell inside the first over and four were down by the sixth. The chase was structurally dead in the powerplay. The eventual 172/9 at 8.6 an over was not a death-overs collapse; it was a chase broken at the start. That is why the 87-run margin genuinely reflects the contest rather than flattering it.
New Zealand's hidden vulnerabilities
- Tim Seifert: caught at third man, continuing a miserable run against India's away-going deliveries. That is a standing technical vulnerability, not a one-off — a selection and technique risk that persists.
- Finn Allen and Daryl Mitchell: both scored quickly but neither converted. The Phillips-Bracewell stand masked this; on another day the same pattern could reduce New Zealand to 150.
Toss and conditions
The report notes that batting first 'probably looked a more promising option'. That supports a reasonable inference: India won the toss and chose to field, consistent with the modern chase-first template. Confidence is medium; the toss is not explicitly stated. There is no information on weather, dew, wind or rain/DLS, so those factors are excluded.
'Not India's day' — an internal contradiction
One line in the original report frames the result as 'not India's day', while the same report documents clear tactical failures: death-bowling discipline collapsing, no plan against spin, and a seam-heavy selection on a short straight boundary. Explaining documented technical failures as misfortune is analytically wrong. This was a performance failure, not bad luck.
Reading the record cautiously
The 'highest T20I total' mark rests on a single-match sample and is inflated by Eden Park's dimensions. It should not be extrapolated into any broader judgement. Similarly, claims such as the 'highest stand against India' are ambiguously worded in the source and should be treated as unverified. Phillips' 46-ball hundred is described as matching his own record, which means he has produced a comparably fast T20I hundred before — a repeatable-skill signal in home conditions.
Series context and travel load
This was a later match in the series, and the report notes it is 'very difficult for a side to adjust to Auckland in two days' — implying a compressed travel schedule. That is a fatigue and preparation factor, unquantified anywhere. The series score is not stated, but India had earlier chased 225 with 80 balls to spare, so this win likely kept the series alive rather than deciding it. Low confidence on that inference.
Takeaways for India
- A dedicated, experienced death bowler is needed — someone who can offer yorkers and cutters from the 16th to the 20th over. Handing a full quota to a part-time seamer is a risk.
- Selection logic must invert on short straight-boundary grounds: control spin and slower balls are safer than full pace. Only three Axar overs and one Dhir over points to exactly this problem.
- In a 260 chase, powerplay restraint and wicket management need revisiting — two wickets in the first over is a plan failure.
For New Zealand
The Phillips-Bracewell stand masked top-order instability; it is not a permanent fix. Seifert's difficulties against the away-going ball and the Allen-Mitchell pattern of fast starts without conversion will persist. And 259 is a gift from home geometry — on tour, the same batting could subside to 170-180.
Editorial note: This analysis rests on figures recorded in a single match report, which are internally consistent (the bowling returns reconcile with the total). The source carried no publication name or date and no team rankings, so no conclusions are drawn about series standing, rankings or weather.